mining for

outperforming markets since 2003
mining for
outperforming markets since 2003
 portfolio performance
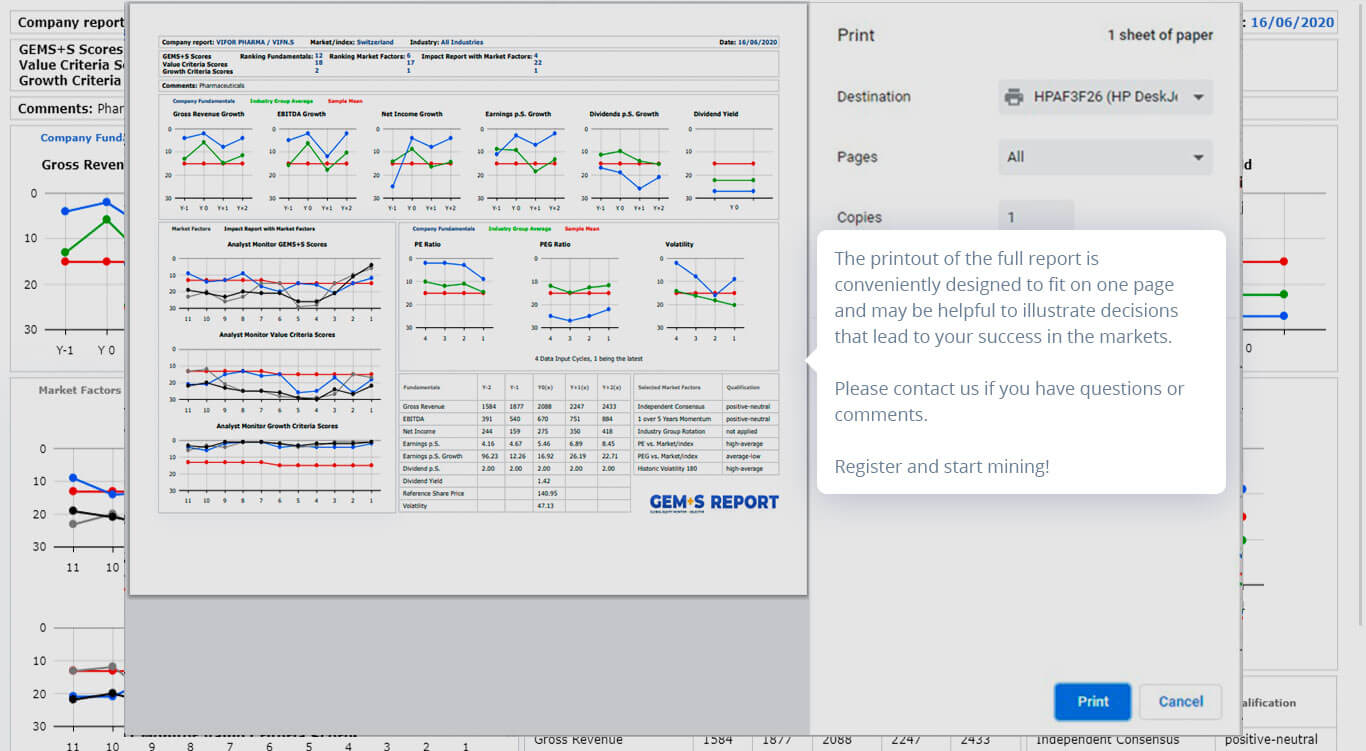
Our bottom-up relative analytics help you select a portfolio of potential high alpha stocks. Avoid low performers by comparing multiple relative factor scorings per stock, industry group and market and choose winners from over 600 companies of selected major markets.
The following table shows ten, five, three rolling years’ and yearly excess returns and shortfalls in % during the last 15 years for USD, EUR and CHF portfolio composites compared to the DJIA, EuroStoxx50 and SMI indices. Dividend yield and portfolio costs not included.
The active-passive strategy includes equal or half weighting for stock positions and up to one third of index near funds. Its bottom-up diversified selection of large caps is not concerned with the usual market capitalization or tracking error considerations of traditional asset management providers.
10 years
DJIA
GEM+S
∆
ESTX50
GEM+S
∆
SMI
GEM+S
∆
2003 – 2012
57.09
105.42
48.33
10.46
69.36
58.90
47.32
129.49
82.17
2004 – 2013
57.88
127.52
69.64
12.62
88.12
75.50
49.48
137.76
88.28
2005 – 2014
65.29
144.29
79.00
6.61
63.63
57.02
57.79
170.21
112.42
2006 – 2015
62.58
143.79
81.21
-8.70
37.81
46.51
16.27
98.36
82.09
2007 – 2016
58.57
134.41
75.84
-20.13
16.00
36.13
-6.44
57.33
63.77
2008 – 2017
86.35
168.89
82.54
-20.36
20.05
40.41
10.58
76.16
65.58
2009 – 2018
165.80
327.33
161.53
22.43
116.87
94.44
52.29
141.71
89.42
2010 – 2019
173.67
359.68
186.01
26.26
139.54
113.28
62.19
147.52
85.33
2011 – 2020
164.36
376.88
212.52
27.21
173.04
145.83
66.31
150.24
83.93
2012 – 2021
197.43
486.64
289.21
85.55
263.10
177.55
116.9
219.50
102.60
2013 – 2022
152.95
348.11
195.16
43.92
106.15
62.23
57.27
95.27
38.00
2014 – 2023
128.36
348.14
219.78
45.44
104.67
59.23
35.78
74.62
38.84
2015 – 2024
139.76
435.25
295.49
54.82
177.05
122.23
29.39
67.87
38.48
2016 – 2025
175.83
516.53
340.71
77.24
203.89
126.64
50.46
95.26
44.81
5 years
DJIA
GEM+S
∆
ESTX50
GEM+S
∆
SMI
GEM+S
∆
2008 – 2012
-1.21
18.85
20.06
-40.09
-21.13
18.96
-19.59
8.95
28.54
2009 – 2013
88.05
151.45
63.40
26.82
87.50
60.68
48.20
113.66
65.46
2010 – 2014
70.91
114.13
43.22
6.07
42.21
36.14
37.24
82.00
44.76
2011 – 2015
50.51
92.51
42.00
17.00
57.16
40.16
37.01
64.80
27.79
2012 – 2016
61.76
111.70
49.94
42.04
81.26
39.22
38.47
69.73
31.26
2013 – 2017
88.64
126.25
37.61
32.93
52.20
19.27
37.51
61.70
24.19
2014 – 2018
41.34
69.94
28.60
-3.46
15.66
19.12
2.76
13.13
10.37
2015 – 2019
60.12
114.68
54.56
19.03
68.45
49.42
18.18
36.00
17.82
2016 – 2020
75.65
147.72
72.07
8.73
73.74
65.01
21.38
51.85
30.47
2017 – 2021
83.87
177.11
93.24
30.63
100.32
69.69
56.64
88.24
31.60
2018 – 2022
34.1
98.06
63.96
8.27
35.44
27.17
14.36
20.76
6.4
2019 – 2023
61.57
163.7
102.13
50.65
76.95
26.3
32.13
54.36
22.23
2020 – 2024
49.74
149.33
99.59
30.07
64.48
34.41
9.49
23.43
13.94
2021 – 2025
57.04
148.88
91.85
63.02
74.91
11.89
23.95
28.59
4.64
3 years
DJIA
GEM+S
∆
ESTX50
GEM+S
∆
SMI
GEM+S
∆
2010 – 2012
25.66
42.59
16.93
-11.14
18.02
29.16
4.22
33.38
29.16
2011 – 2013
42.55
69.82
27.27
11.32
42.90
31.58
27.45
44.93
17.48
2012 – 2014
45.88
77.42
31.54
35.82
57.24
21.42
51.33
68.97
17.64
2013 – 2015
32.97
56.19
23.22
23.96
35.01
11.05
29.25
38.21
8.96
2014 – 2016
19.74
30.05
10.31
5.84
13.14
7.30
0.21
12.76
12.55
2015 – 2017
38.69
50.67
11.98
11.36
26.32
14.96
4.44
18.50
14.06
2016 – 2018
33.87
49.91
16.04
-8.14
5.17
13.31
-4.41
-0.51
3.90
2017 – 2019
44.41
79.92
35.51
13.82
46.12
32.30
29.16
35.39
6.23
2018 – 2020
23.81
71.01
47.20
1.39
54.11
52.72
14.09
29.79
15.70
2019 – 2021
55.77
112.06
56.29
43.21
95.96
52.75
52.75
87.64
34.89
2020 – 2022
16.15
39.00
22.85
1.29
1.57
0.28
1.06
5.22
4.16
2021 – 2023
23.14
59.59
36.45
27.28
7.11
-20,17
4.06
1.14
-2.92
2022 – 2024
17.6
61.88
44.28
13.33
19.98
6.65
-9.72
-11.22
-1.5
2023 – 2025
45
114.89
69.89
52.66
99.02
46.36
23.66
38.21
14.56
Years
DJIA
GEM+S
∆
ESTX50
GEM+S
∆
SMI
GEM+S
∆
2012
7.26
18.15
10.89
13.79
30.50
16.71
14.93
23.83
8.90
2013
25.95
37.78
11.83
17.95
22.76
4.81
20.24
21.55
1.31
2014
7.99
8.99
1.00
1.20
-1.85
-3.05
9.51
12.26
2.75
2015
-2.23
4.01
6.24
3.85
12.05
8.20
-1.84
1.29
3.13
2016
13.42
14.72
1.30
0.70
2.88
2.18
-6.78
-0.83
5.95
2017
25.08
26.27
1.19
6.49
9.58
3.09
14.14
17.97
3.83
2018
-5.63
3.49
9.12
-14.34
-6.71
7.63
-10.15
-14.95
-4.80
2019
22.34
37.68
15.34
24.78
42.94
18.16
25.95
34.96
9.01
2020
7.24
20.02
12.78
-5.14
15.57
20.71
0.82
13.09
12.27
2021
18.73
28.33
9.60
20.99
18.62
-2.37
20.29
22.94
2.65
2022
-8.78
-9-75
-0.97
-11.74
-25.91
-14.17
-16.67
-24.32
-7.65
2023
13.7
37.79
24.09
19.19
21.88
2.69
3.81
8.7
4.89
2024
13.38
30.07
16.79
7.74
32.86
25.12
4.37
7.92
3.55
2025
12.48
19.81
7.33
18.88
22.9
4.02
14.14
17.82
3.68
This table does not constitute advice or solicitation regarding the selection of or transactions in financial instruments. It is a record of past reference portfolio activity and success. Please bear in mind that past performance is no guarantee for future results. Seek advice of licensed professionals when taking investment decisions.
Look and feel
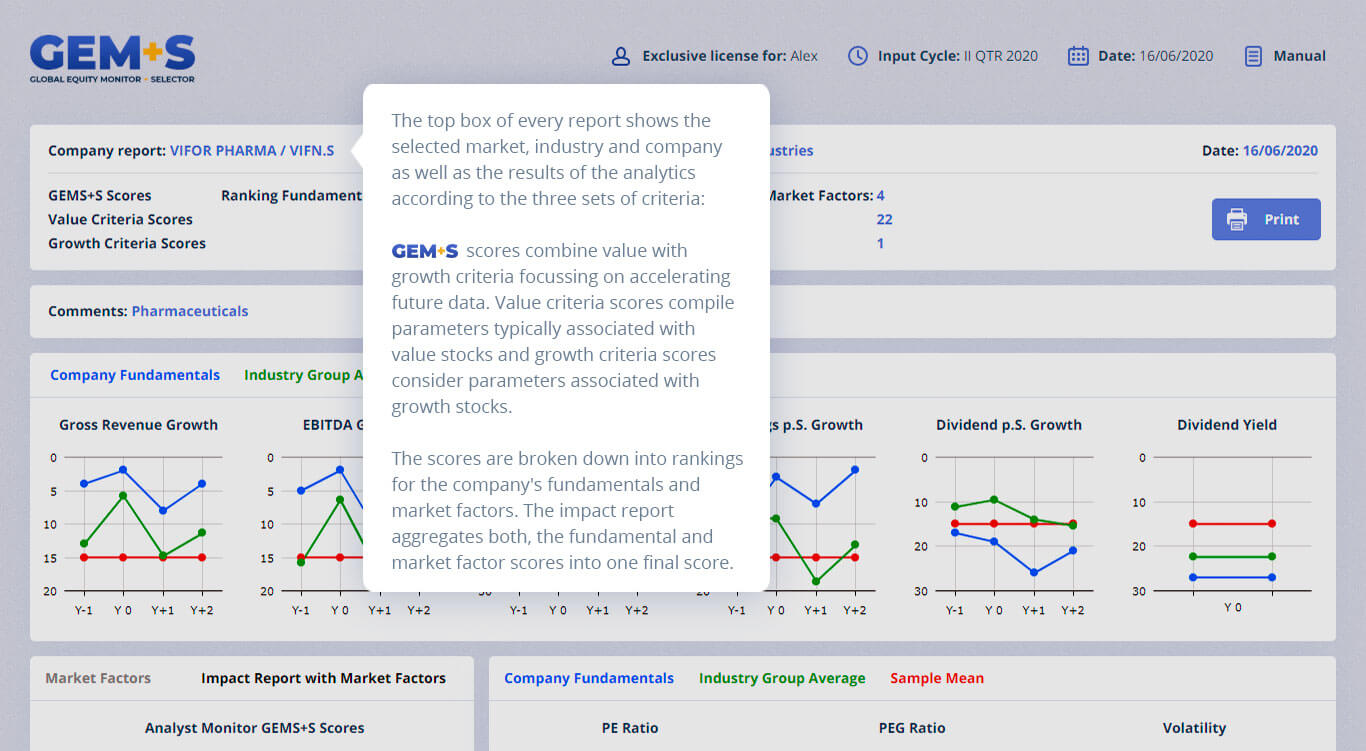
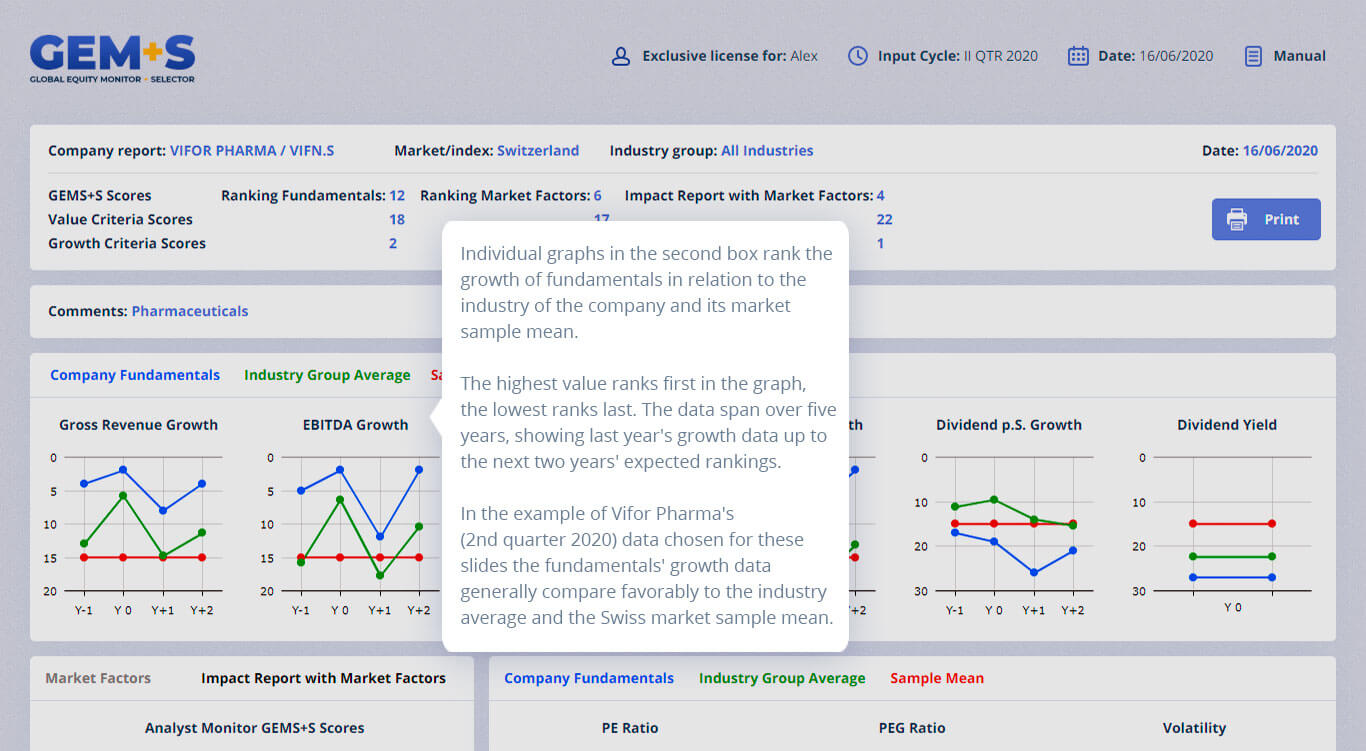
The risk and reward paradigm is at the heart of Investment Management. The mainstream investment managers do an excellent job in managing risks but do poorly managing the rewards. GEM+S is in the business of managing rewards. Decades of experience and continued learning about Finance, Financial Analysis, Asset Management and Investment Policy making at the helm of the world’s leading private wealth organization produced a simple, comprehensive and innovative tool with game changing algorithms that capture the essence of global equity markets.
There is enough evidence that GEM+S not only enriches your approach to investing in the global equity market place, but eventually also your and/or your clients’ wallets - with a minimal investment generating the potential for top returns!
GEM+S does not offer Asset Management services to avoid any conflict of interests and the results of its research and analysis do not constitute advice or solicitation regarding the selection of or transactions in financial instruments.
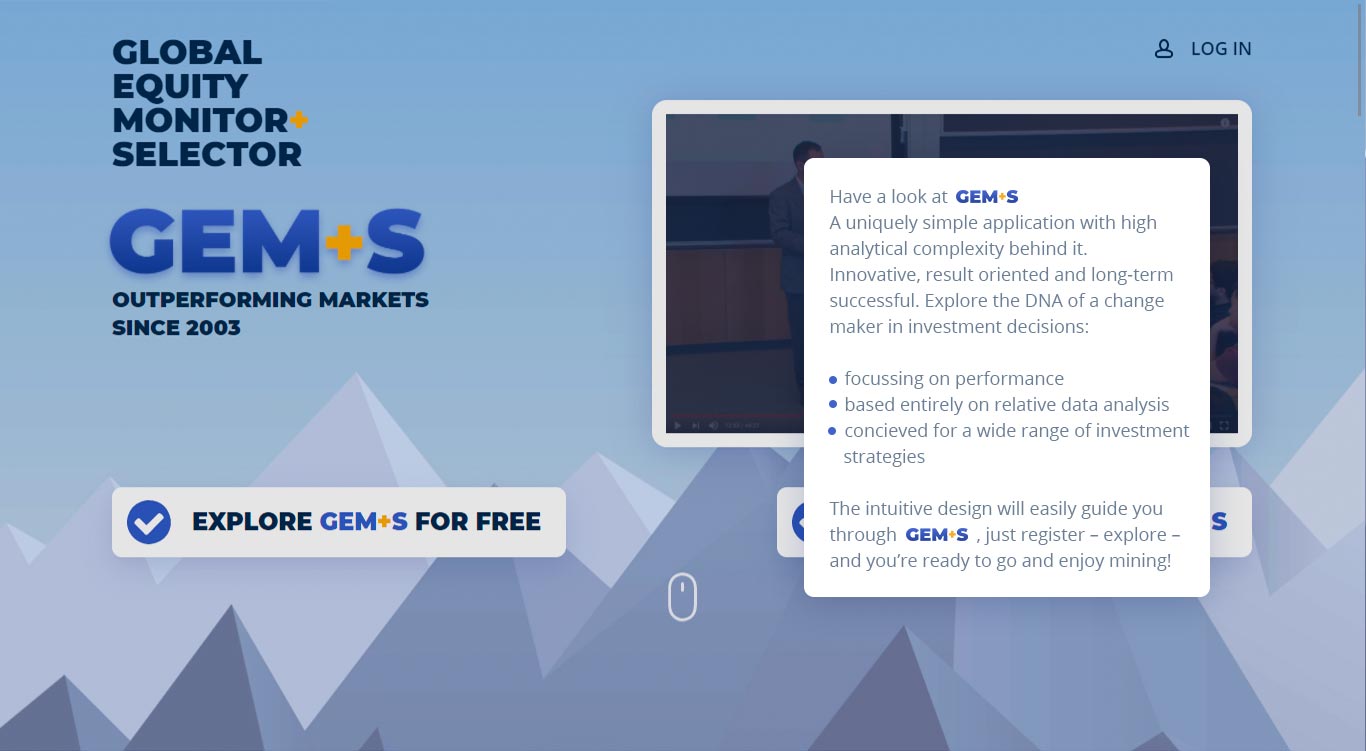
If you wish to see how GEM+S’ results look and feel please register for your limited free trial or click on the "LOOK AND FEEL" button; and if you like what you see simply proceed to the payment module for your full subscription. Enjoy mining!
To register and login follow the self-explanatory instructions menu. Start mining GEM+S and move the cursor to the top of the page to activate the fading menu bar. For your best mining experience expand to full screen. Open new tabs to compare results for several companies at the same time by right-clicking on the link "Manual" on the top right corner of the welcome page. The intuitive design of the tool makes it easy to use; first look at the right end of the fading menu bar:
RPP (GEM+S Reference Portfolio Positions): the long term performance record of these portfolios shows the relevance of the GEM+S analytical approach. GEM+S provides you with the list of the current year’s stock selection in its USD, EUR and CHF portfolios as a special benefit for subscribing to this tool.
Result: the current year’s selection is based on the previous year’s 4th quarter GEM+S analytics and positions only exceptionally change due to market driven re-balancing, but usually remain unchanged during the calendar year, sometimes over several years - long term investing wins over short term trading passions.
The performance record shows:
Settings: manage your subscription following the self-explanatory instructions menu.
Contact: contact us with your comments or questions regarding your mining experience.
Now turn to the real mining experience
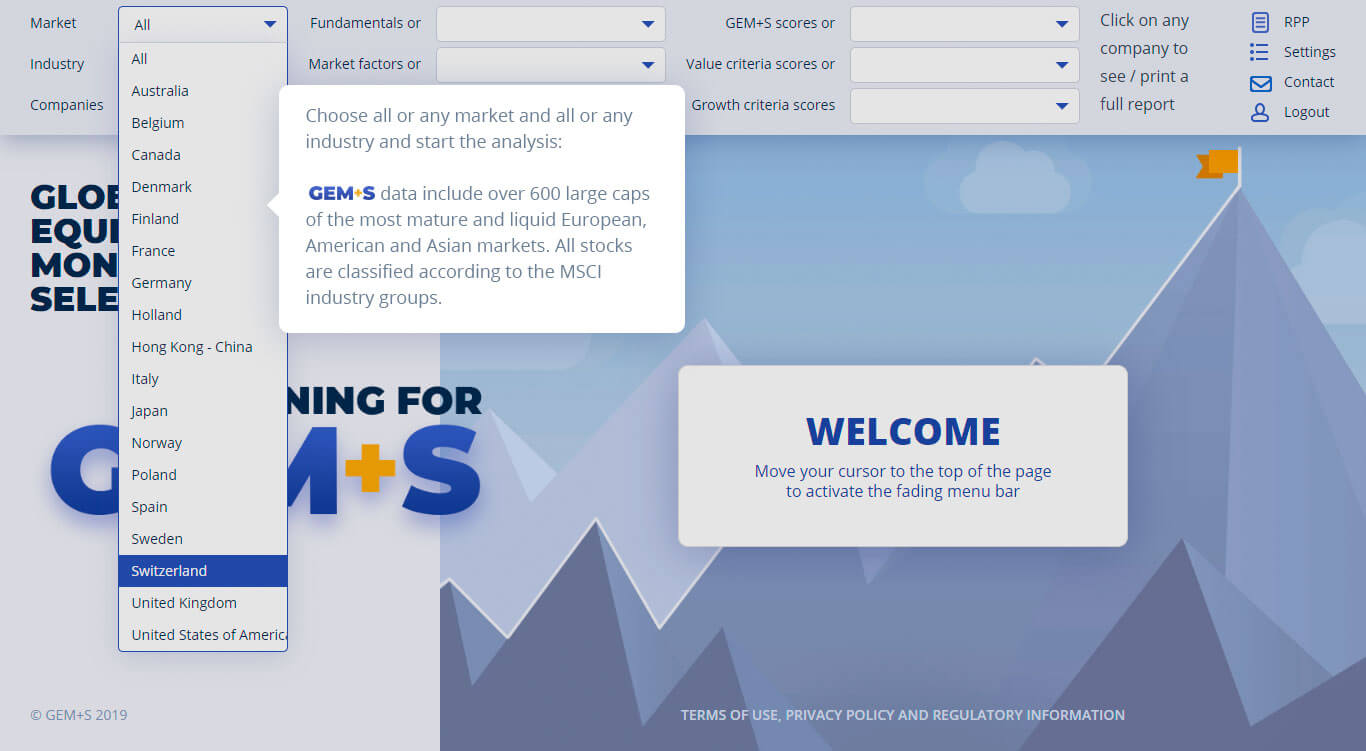
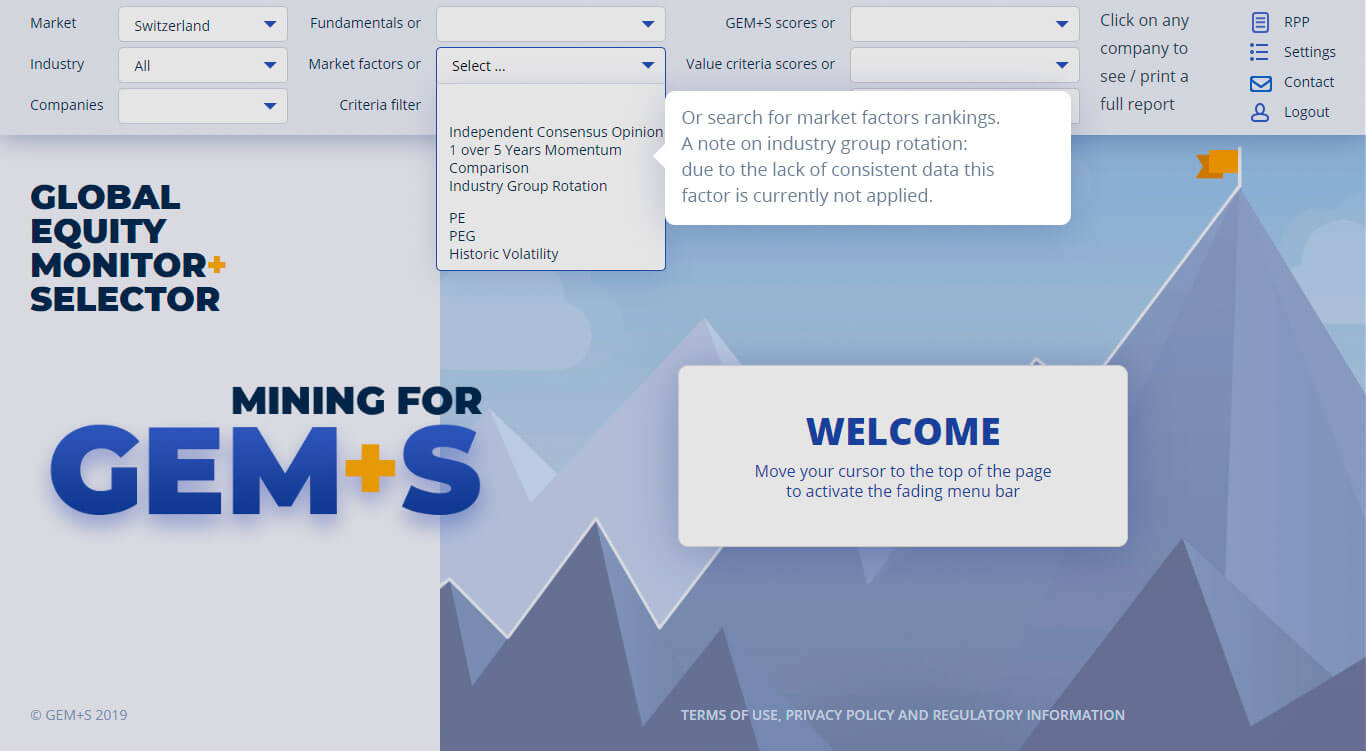
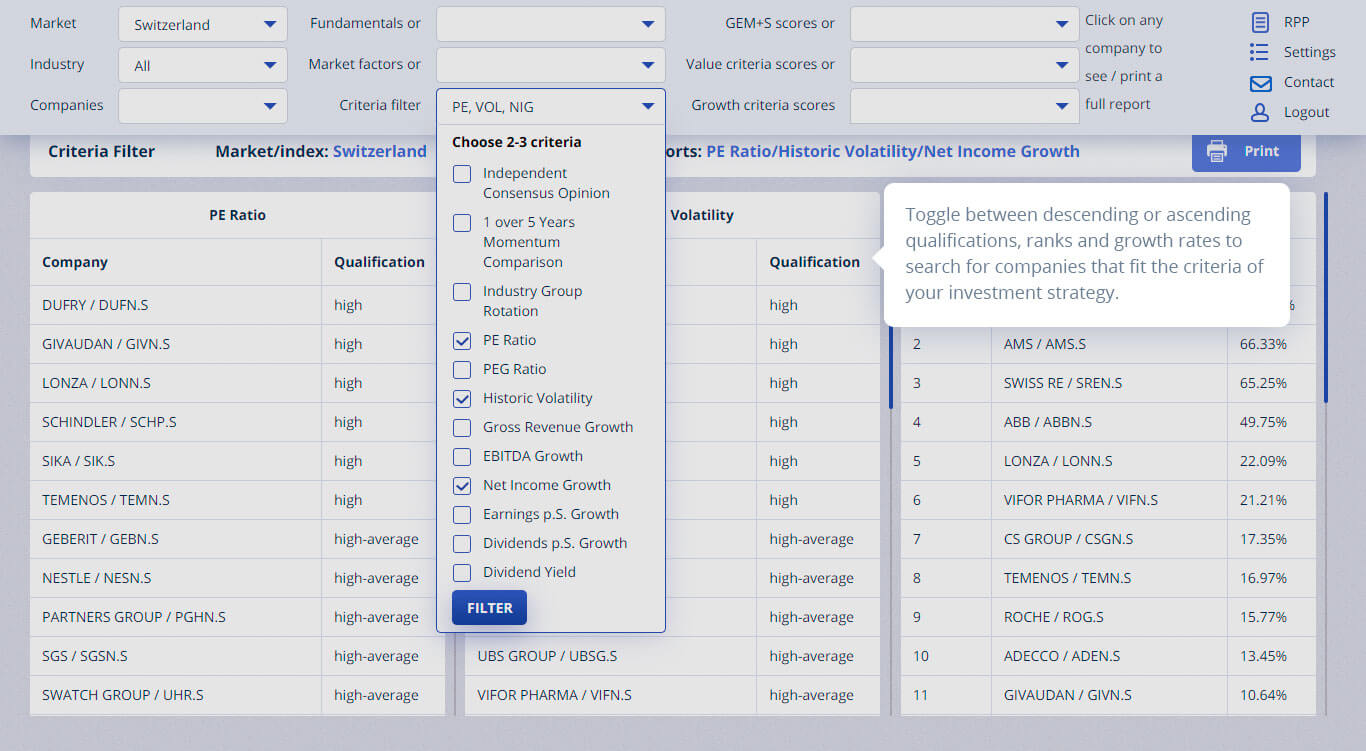
First: choose the Market in which you wish to analyze companies. Choose All if you want a global perspective; however, given the different market maturity, market capitalization and reporting standards you may want to be cautious when drawing final conclusions for single companies’ rankings across all markets.
Result: all your further queries will refer to your choice of markets. You can directly move your cursor on the fading menu bar to the right and choose a full company report from the three drop-down lists available.
Second: choose the Industry Group (MSCI classification of 10 groups) or All industry groups of a chosen market.
Result: all your further queries will refer to your choice of markets and industry groups.
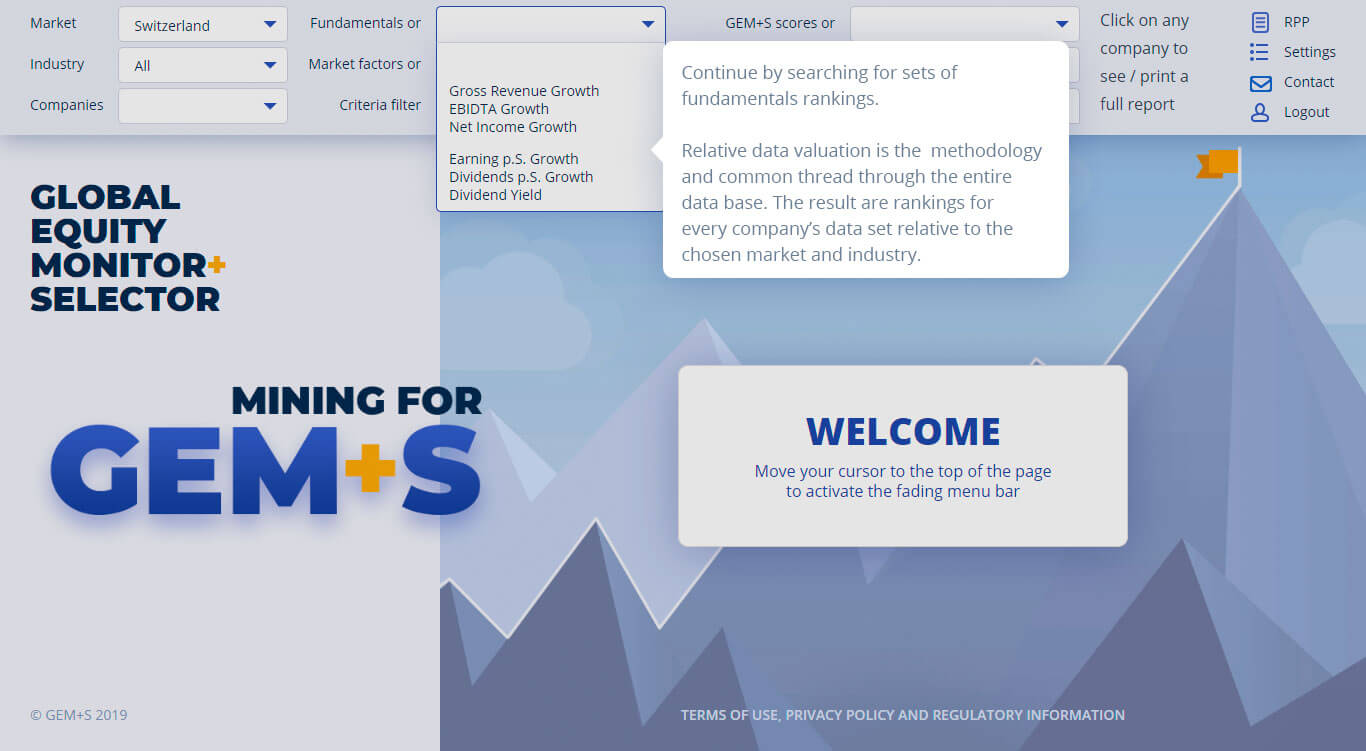
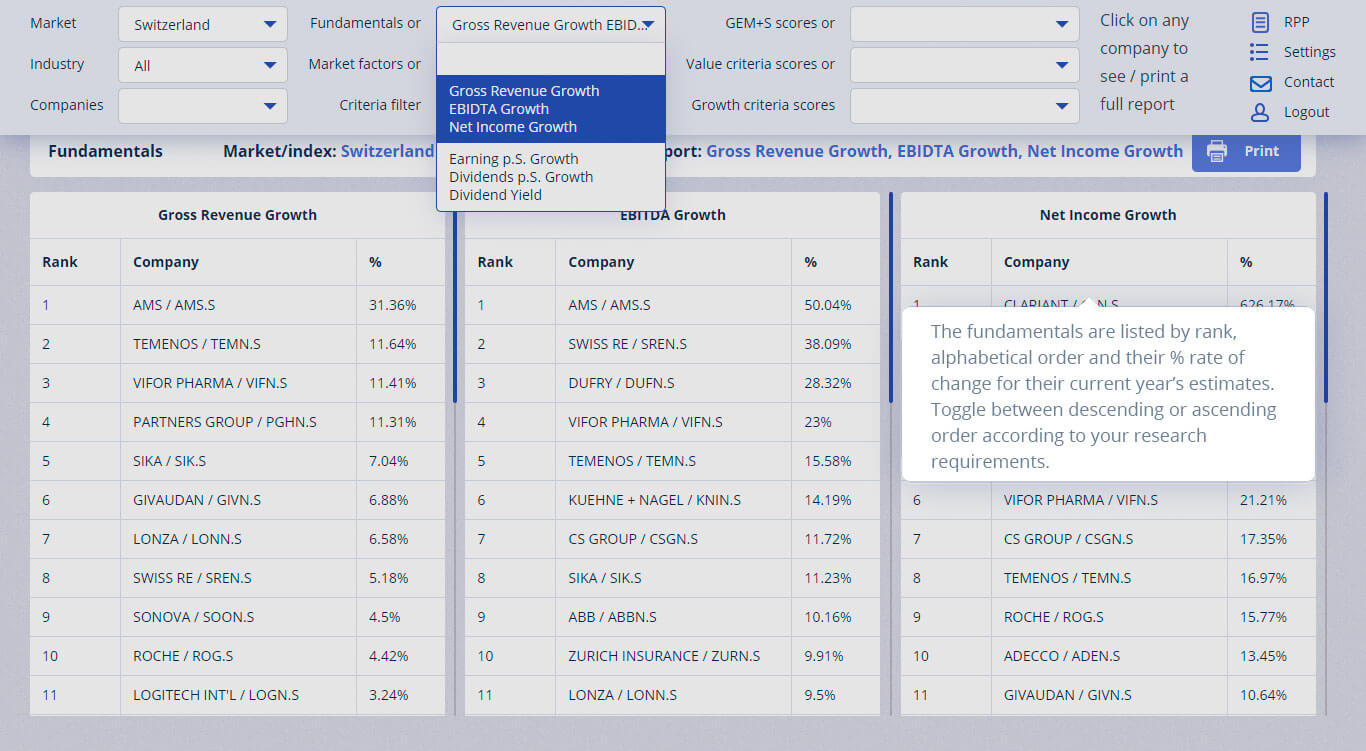
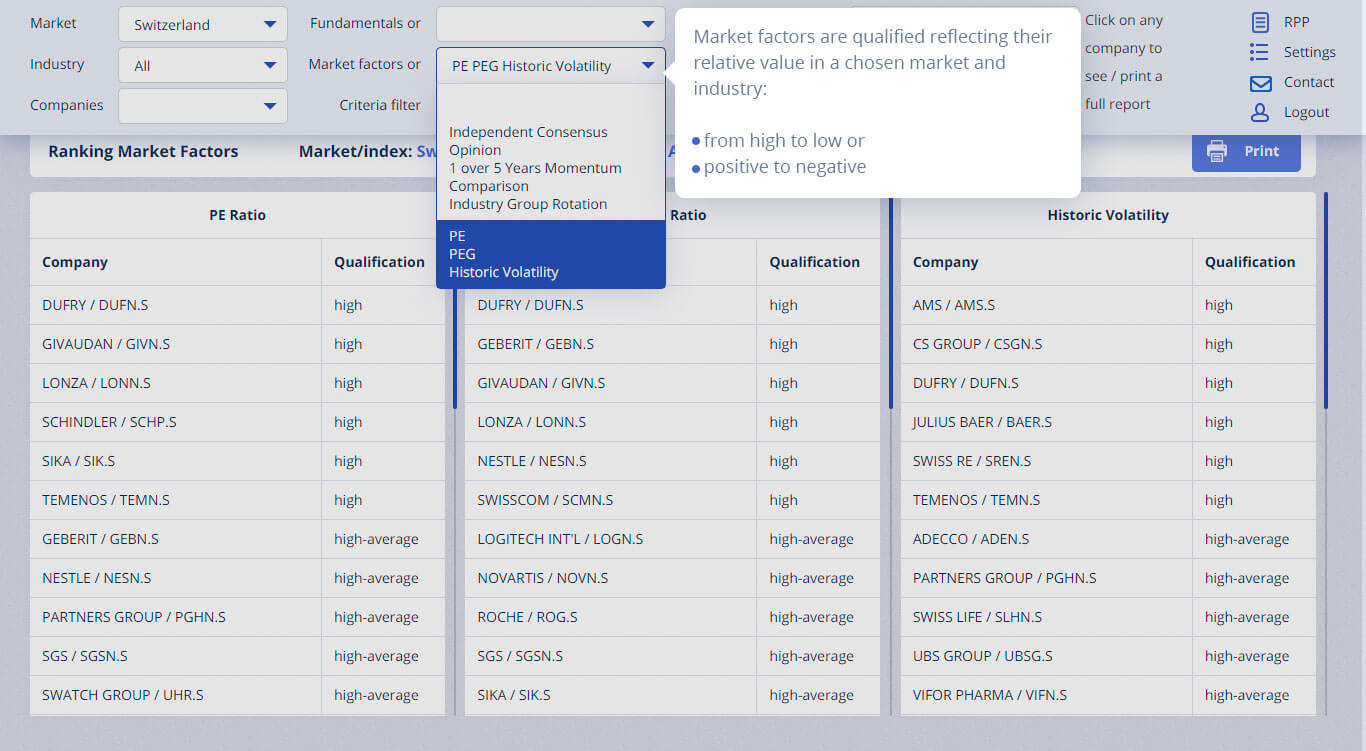
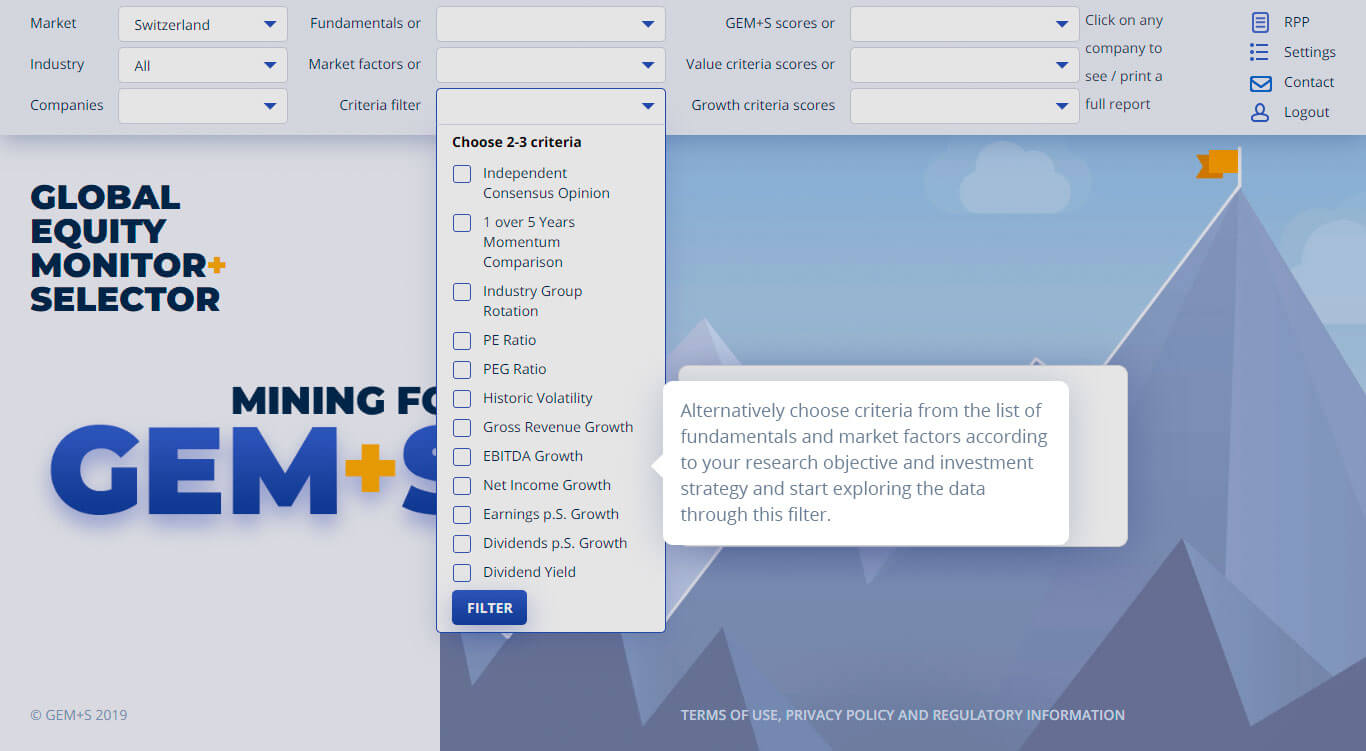
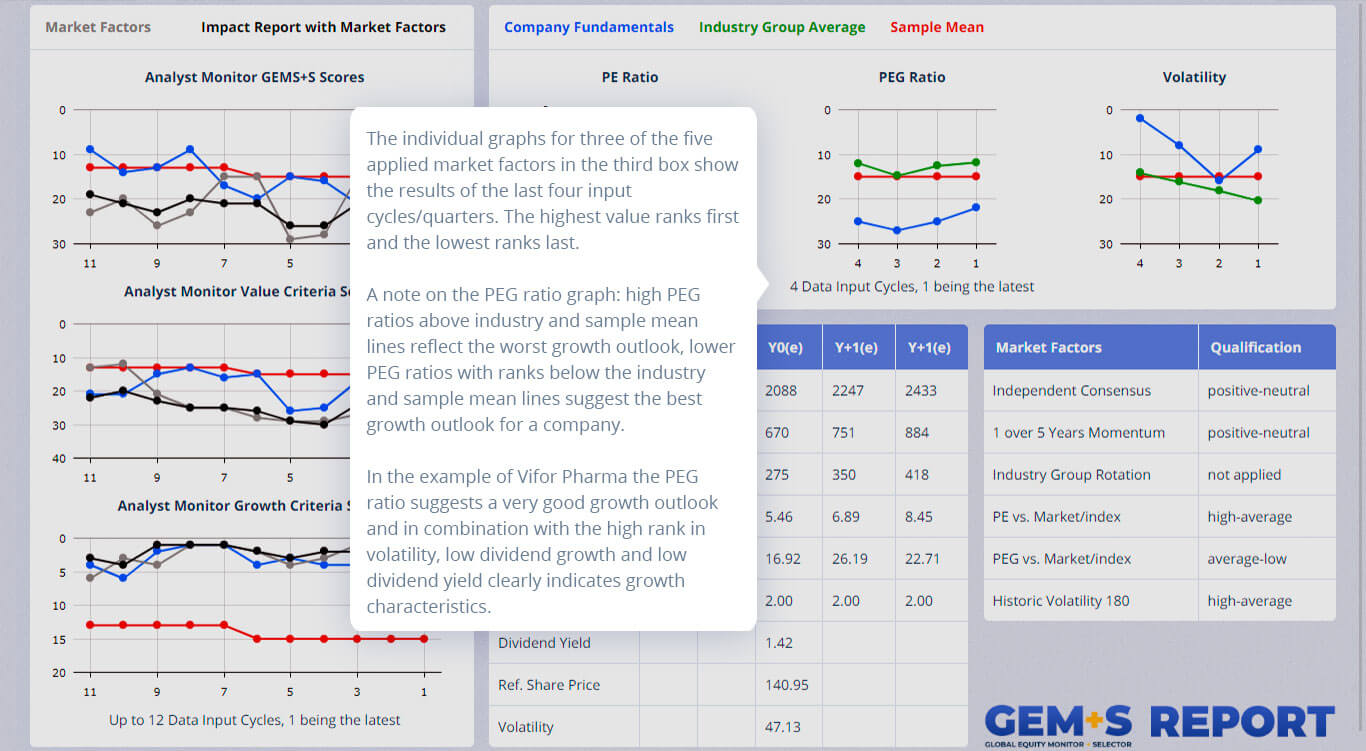
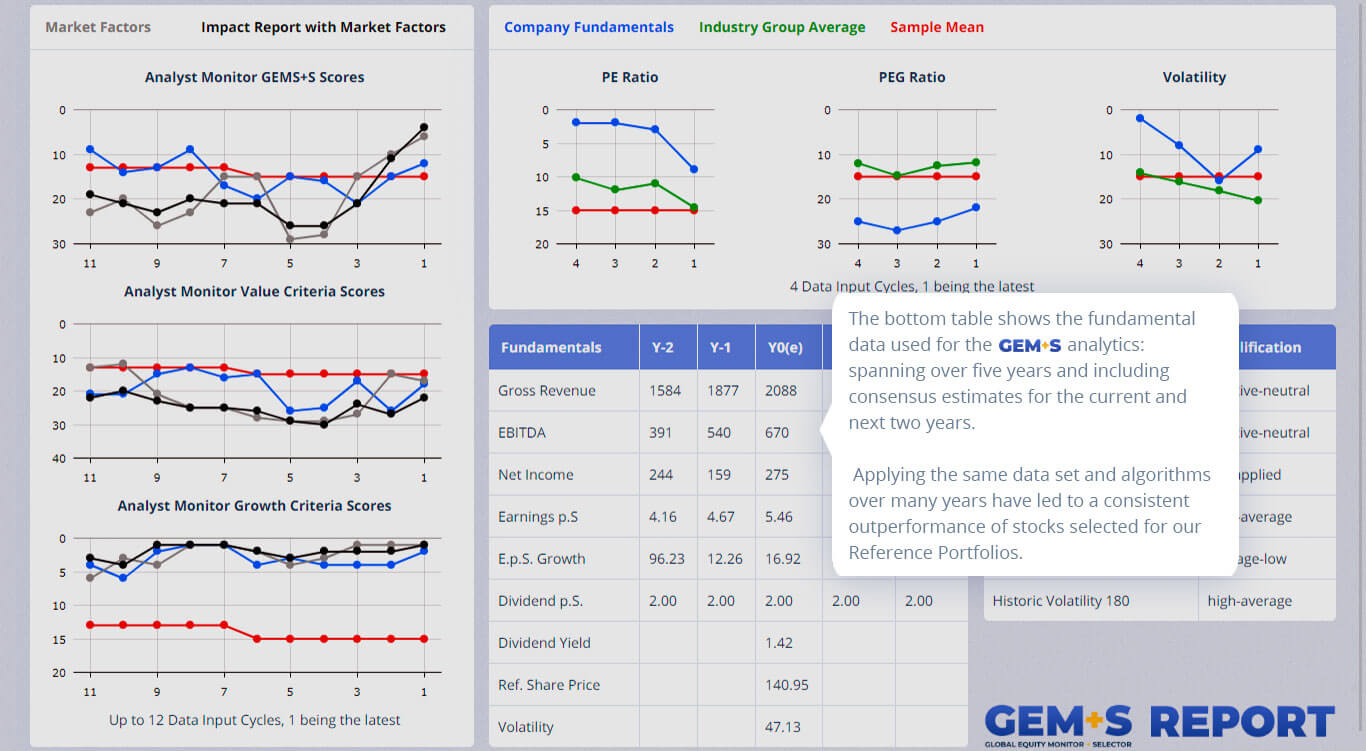
Third: choose Fundamentals or Market Factors, if you wish to analyze the rankings of companies within the chosen market. Fundamentals and market factors are based on consensus data pooled from typically 5 to 20 analysts covering a particular company.
Result: click on a block of three fundamentals or market factors:
Gross Revenue growth
EBITDA growth
Net Income growth
Earnings per Share growth
Dividends per Share growth
Dividend Yield
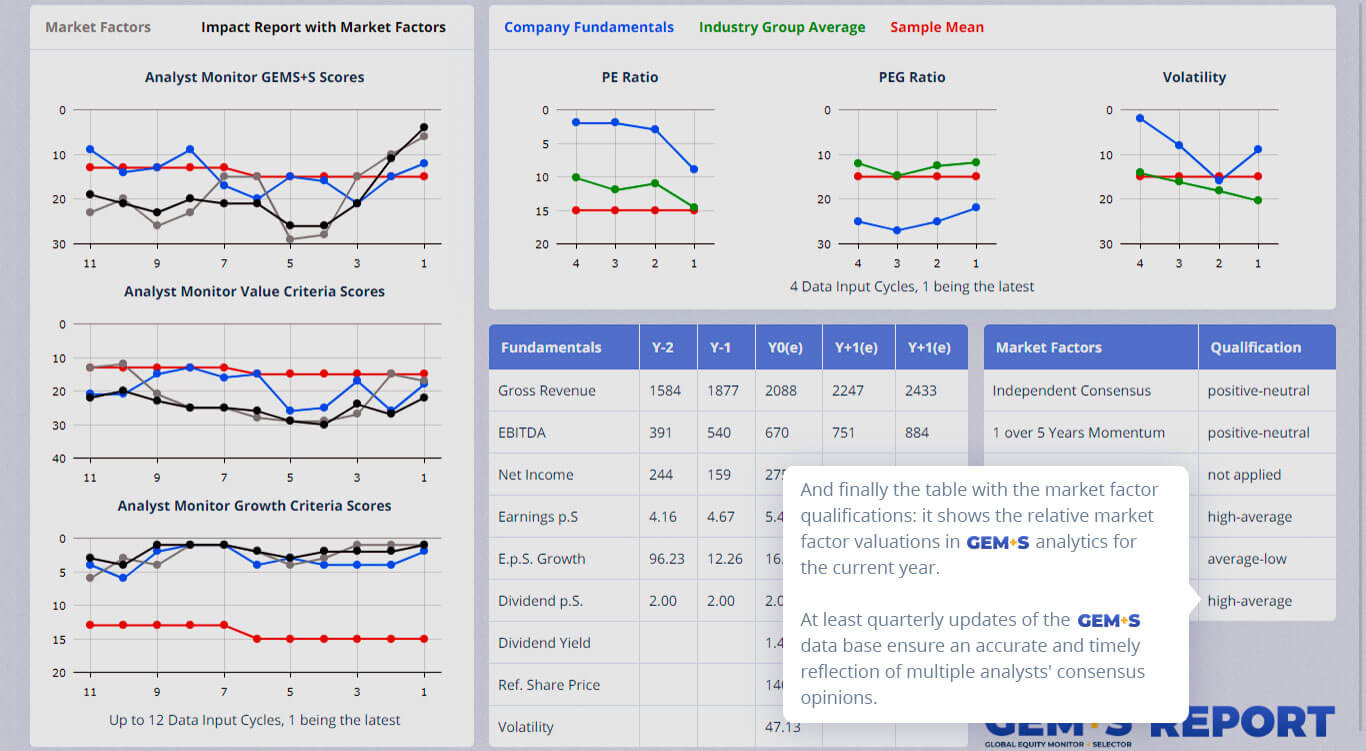
Independent Consensus Opinion about the future price trend of a share
1 over 5 Years Momentum of a share price vs. the market
Industry Group Rotation, cycle momentum (not applied, no consensus data across markets available)
PE vs. Market, ratio between current share price and earnings estimate vs. the market
PEG vs. Market, ratio between PE and estimated EPS growth vs. the market; the lower the ratio (= bigger the ranking number) the more attractive the stock
Volatility of a share price relative to the market volatility (180 days volatility)
highest to lowest rank,
alphabetical up or down order of companies or
highest to lowest percentage or qualifier
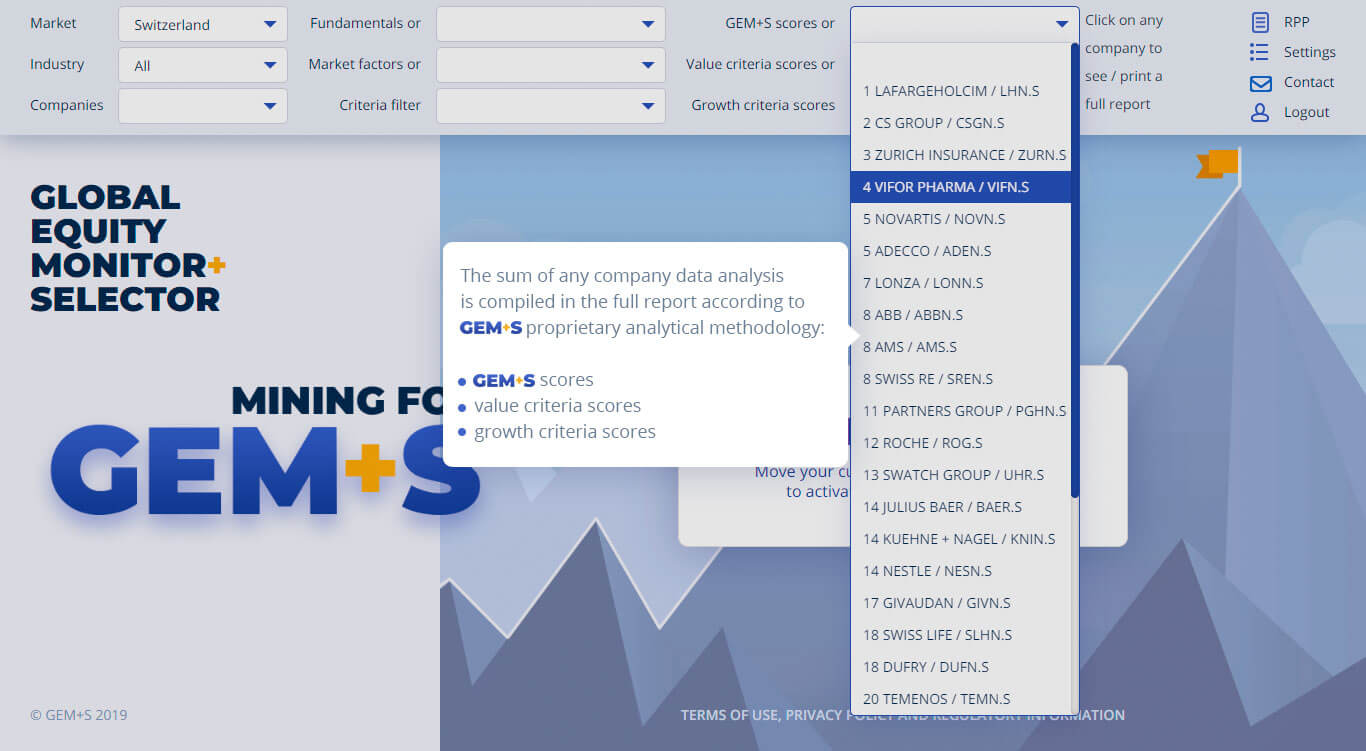
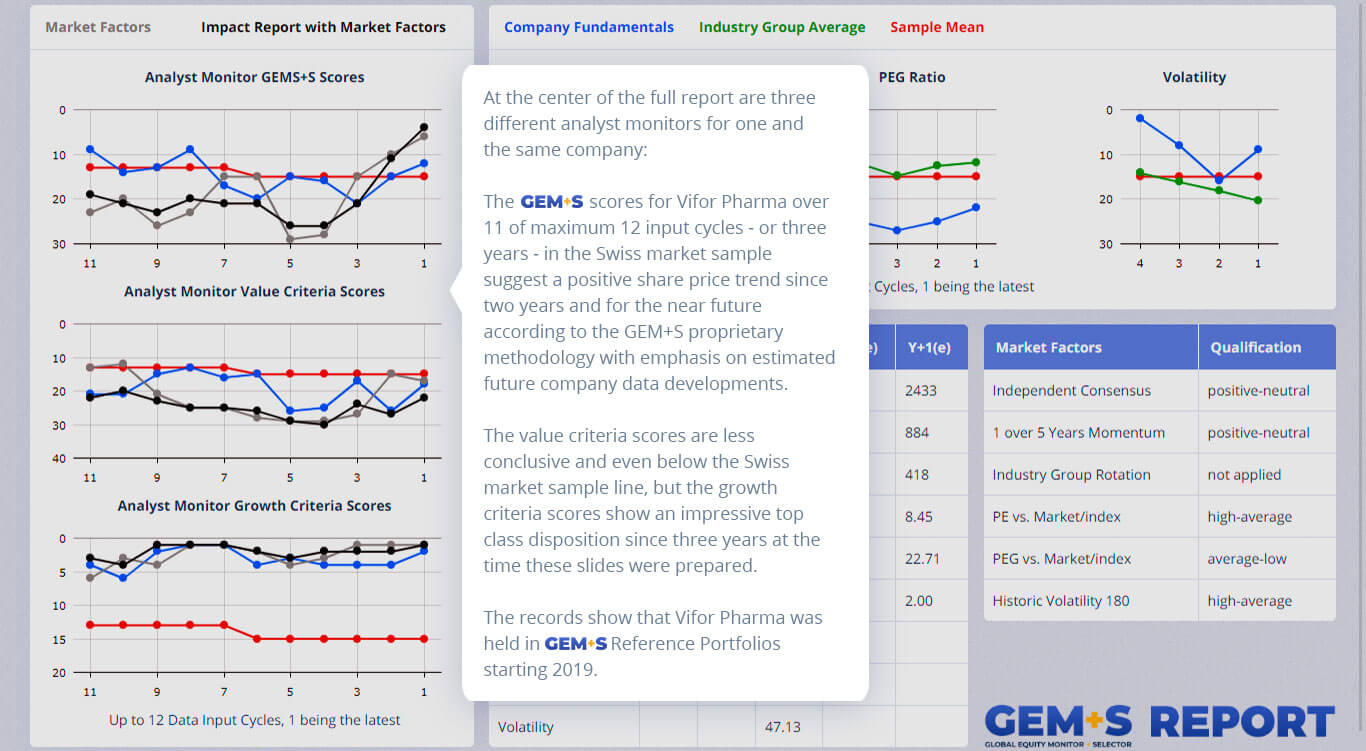
Fourth: choose the type of rankings you want GEM+S to produce; according to GEM+S proprietary analytics criteria scores, Value criteria or Growth criteria scores.
Result: click on a company name on the drop-down ranking list to obtain the full report:
Fifth: search for your preferred combination of fundamentals and market factors and click Filter to filter/search for companies that meet your requirements and chosen strategy.
Result: you may be searching for specific investment strategies or risk appetite, for example:
A small investment for the potential of substantial returns given the performance results achieved in our reference portfolios since 2003: one license subscription for 900.00 CHF per year gives exclusive access to one user. For any additional license you pay 90 CHF. GEM+S may well be worth to be your best kept secret regarding your successful investment decisions - what miner likes to share the location of his or her most prolific mine?
If you wish to see how GEM+S results look and feel please register for your limited free trial or click on the "LOOK AND FEEL" button; and if you like what you see simply proceed to the payment module for your full subscription. We shall remind you one month before the end of your yearly subscription that continued mining for GEM+S will require payment within 30 days. Should you miss your deadline and find the door to your mine closed, just proceed to the payment module to reopen and continue where you have left off.
Please consult the “Terms of Use, Privacy Policy and Regulatory Information” you accept with your login into GEM+S; for the avoidance of doubt and as a reminder some (but not all) limitations to the use of our system:
But we are also well aware that GEM+S ability to enforce this orderly use of our system depends on the integrity and goodwill of its users, and we would like to draw your attention to the users’ agreeing to our right to defend our intellectual property before the competent courts of law and to the users’ obligation to indemnify GEM+S for any misuse and/or damage caused by not observing their end of this contractual commitment (please refer to the “Terms of Use, Privacy Policy and Regulatory Information”).
Welcome to the GEM+S registration process. please provide all requested data to register successfully. register a fantasy short name to be used as user name together with your password to login. once the registration is confirmed by e-mail you are good to go and enjoy mining.